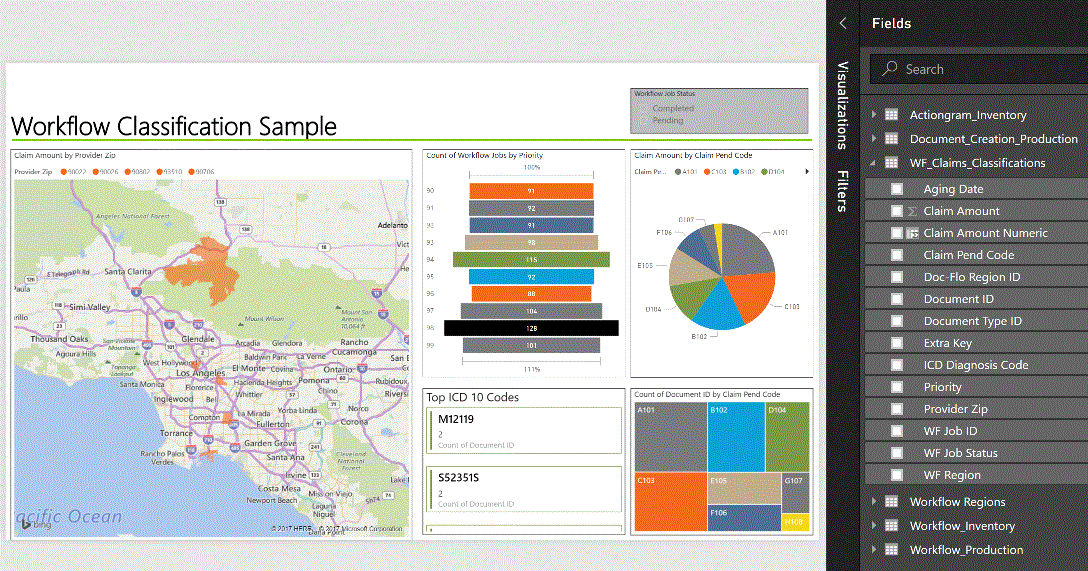
The video below shows how easy it can be for users to create ad-hoc Power BI dashboards using Macess Workflow Classification data and Service Form data.
This same data can also be made available to other reporting tools such as Tableau, Qlik, or Cognos.
Typically, in order to create reports for Workflow Classification data or Service Form field data you must have an in depth knowledge of both the Macess database and T-SQL. As the video above shows, this is not the case if the necessary data preparation steps are taken.
Users are able to simply drag and drop fields from the field list on the right to build reports and dashboards.
In the screenshots below, Workflow Classification fields and Service Form fields have been exposed and organized in ways that will be familiar to any Macess user. No database or T-SQL knowledge required.

You can see on the right side in the following screenshot that Macess Service Form fields have been arranged in to their “tabs” as users are familiar with.
